Linear Regression In Data Analysis
Let’s talk about Linear Regression, a huge part of Regression Analysis, which is a very very popular topic these days in data science and statistics.
What is Linear Regression
In simple terms is as attempt to fit a straight line, some kind of a linear function, to a set of data points. Τhen using that function (for example y = 2x + 3) we try to predict new values that we haven’t encounter yet. Sounds fancy, but it’s actually a very simple concept. Basically it’s high school math.
That’s all there is to it. Nothing more and nothing less.
In practice we do 2 things:
- Fit a line to a data set of observations.
- Use this line, to predict unobserved values. This values might be future ones, or past ones.
How Does Linear Regression Works
- Using the Least Squares Method. The Least Squares Method, is used to construct the graph that describes a phenomenon, when we know ONLY a series of experimental values of the sizes that describe it, and NOT the exact mathematical relation (type).
In reality, when studying a phenomenon, we try to identify the form of the unknown mathematical relation to which our experimental data best fit, by checking a series of known data sets. - Least squares minimizes the sum of squared errors. This is the same as maximizing the likelihood of the observed data. Especially if you are thinking of the problem in terms of probabilities and probability distribution functions.
- Often is called “Maximum Likelihood Estimation“.
Other Techniques
- Gradient Descent is an alternate method to Least Squares.
- Iterates to find the line that best follows the contours defines by the data.
- Makes a lot of sense when dealing with 3D data.
How Well Our (Least Squares) Line Fits Our Data
We can figure this out by using R-Squares (aka Coefficient of Determination).
This measures the fraction of the total variation in Y that is captured by the model.
Simple put, is how well does our line follow the variation that is taking place. Are we getting an equal amount of variance on either side of our line or not?
[latexpage] \[ r-squared =\frac{sum of squared errors}{sum of squared variation from mean} \]
This mathematical type is not really intended to be used in practice by us, because Python will do that for us.
Practical Example Using Jupyter Notebook.
I will assume that you already have Python installed, and Jupyter library as well. The notebook code will be provided in the end of this tutorial.
For starters, lets create some data showing almost a linear function between page speed of an e-shop, and the amount clients spend:
%matplotlib inline
import numpy as np
from pylab import *

pageSpeed = np.random.normal(3.0, 1.0, 1000)
moneySpent = 100 - (pageSpeed + np.random.normal(0, 0.1, 1000)) * 3

scatter(pageSpeed, moneySpent)
Output: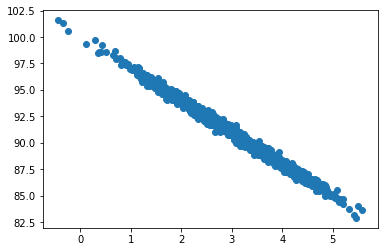
Because we have only 2 variables (page speed and amount) we can just use scipy.state.linregress:
from scipy import stats

slope, intercept, r_value, p_value, std_err = stats.linregress(pageSpeed, moneySpent)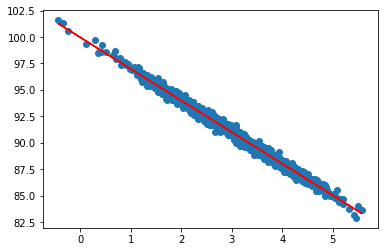
r_value ** 20.9896467036924713Not surprisngly, our R-squared value shows a really good fit.Let’s now use the slope and intercept we got from the regression, in order plot predicted values vs. observed:
import matplotlib.pyplot as plt

def predict(x):
    return slope * x + intercept

fitLine = predict(pageSpeed)

plt.scatter(pageSpeed, moneySpent)
plt.plot(pageSpeed, fitLine, c='r')
plt.show()
Output:
Click to download the Jupyter notebook linear regression source code , or view the current notebook online.